
Decide with data analysis tools
Analyze with Tableau
What is Tableau?
Tableau is a leading business intelligence and data visualization platform that enables companies and organizations to analyze large volumes of data intuitively and efficiently. A tool that facilitates the creation of interactive dashboards and dynamic control panels.
Connects to a variety of data sources
With Tableau, it is possible to connect to different data sources, from databases to local and cloud files. This makes Tableau one of the most versatile tools for data visualization.
PKF Attest: gold partner and expert Tableau implementers for customized data analytics solutions
Our customers


Why choose Tableau?
It is a market-leading business intelligence solution that offers a wide range of benefits for your data analysis project. Here are some key reasons why:
Agility and speed of analysis
Tableau is 10 to 100 times faster than other existing solutions. It offers the ability to connect and visualize your data in minutes.
Intuitiveness and accessibility
Analyze advanced data intuitively and for any level of analytical knowledge. Drag-and-drop logic.
Compatibility of different data sources
Diverse data sources: spreadsheets, cloud services, databases and Hadoop. Explore and consolidate data in one place, with end-to-end insight.
Creation of intelligent dashboards
Combine multiple views of data to gain a more detailed understanding. Discover best practices for communicating information and identifying trends.
Automatic data update
Connections in real time or scheduling automatic updates according to your preference. Work on recent and business-relevant data.
Modern analysis flow
The workflow is composed of five key actions: access and view, interact, discover, share and promote, and govern.
Unleash the power of your data with Tableau. Powerful decisions and intelligent visualization
Data analysis software functionalities
Tableau transforms the way organizations interact with their data. From data collection and transformation to visualization and interpretation, a comprehensive solution that powers modern business intelligence and provides key insights to drive strategic change.

Interactive graphics

Dynamic tables

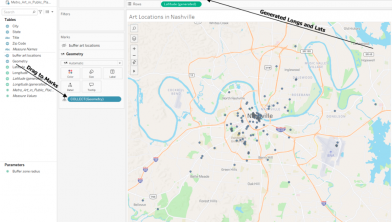
Geospatial maps
Flow diagrams

Visualization of relationships and trends

Pattern identification
Predictive analytics
Multidimensional data
Creation of customized measurements

Advanced analysis with Machine Learning
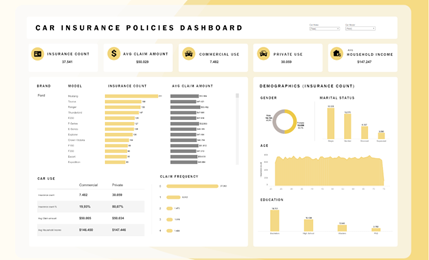
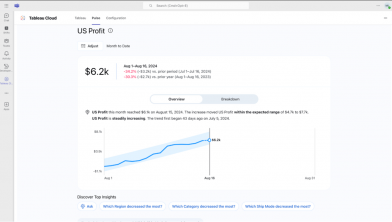
Example Tableau dashboards
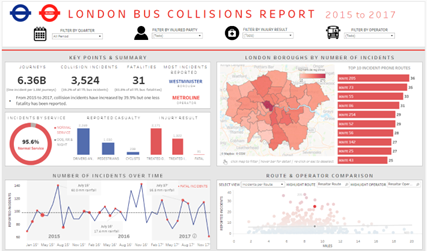
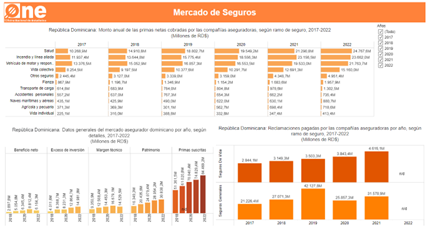
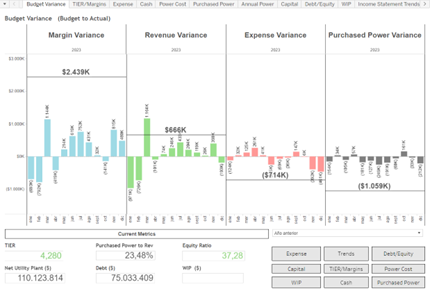
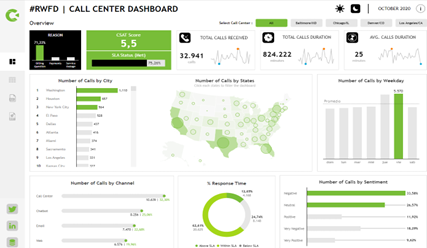
Tableau Connections
A connected data analysis tool
Tableau offers an integrated solution that lets you work with your data on a unified platform. With Tableau Online and Public, you can access your reports and dashboards from anywhere, as long as you have Internet access. And it integrates with a variety of services and platforms, making it easy to collaborate and synchronize data within your business environment.
Tableau and PKF Attest: successful implementation of analytics software
We go beyond implementing a Data visualization basic

We are Tableau experts. Take advantage of our experience!

We provide guidance at all stages of the project.

Continuous technical support! The most timely assistance

Close collaboration with customers and their needs

Periodic Tableau updates

Access to professional services. Among the top 10 consulting firms

How to implement Tableau in the enterprise?
Stages of Tableau implementation
Request a pre-audit! We analyze your project and offer you a solution tailored to your needs.
"We have been able to see how the technology has indeed come to improve the work. When we contacted PKF Attest to ask for information about Tableau and subsequently implemented it, we didn't know all the benefits and agility we were going to get."
CFO Funsan
Sectors
Transportation sector

Hotel sector

Financial sector

Pharmaceuticals

Private security sector

Automotive sector

Sports betting sector

Food sector


Questions about Tableau
What are the requirements for implementing Tableau in my company?
The requirements for deploying Tableau can vary depending on the scale and complexity of your data infrastructure. Typically, you will need access to relevant data sources, Tableau licenses for users and, in some cases, secure data connectivity setup.
What training is required to use Tableau effectively?
Tableau offers a variety of training resources, including free online tutorials, classroom and virtual training courses, and extensive documentation. Hands-on experience and self-study exploration can also be helpful to fully understand the platform's capabilities.
What types of reports and dashboards can I create with Tableau?
Tableau allows you to create a wide range of interactive reports and dashboards, from simple charts and tables to more complex visualizations such as maps, flowcharts and dynamic charts.
How can I share reports and dashboards with other users within my organization?
Tableau offers several options for sharing reports and dashboards, including publishing to Tableau Server or Tableau Online, distribution of Tableau files, and the option to embed visualizations in internal portals or websites.
What is the difference between Tableau Desktop and Tableau Server/Tableau Online?
Tableau Desktop is a desktop application that enables users to create reports and visualizations. Tableau Server and Tableau Online are cloud platforms for sharing, collaborating, publishing and managing access to Tableau reports online.
Can I integrate Tableau with other tools and applications we already use in our company?
Yes, Tableau integrates with a variety of tools and services, including Salesforce, Google Analytics, Microsoft Azure and more, through connectors and APIs. This makes it easy to integrate Tableau into your existing technology infrastructure.
How can I ensure data security in Tableau?
Tableau offers a number of security features, including role-based access controls, user authentication through Active Directory and other authentication systems, encryption of data in transit and at rest, and support for security standards such as GDPR and HIPAA.
What is the cost associated with using Tableau?
Tableau offers different licensing plans, ranging from the free Tableau Public version to commercial plans with advanced features and enterprise scalability. The exact cost depends on the number of users, required features and deployment option (on-premises or cloud).
Can I access and view my Tableau reports from mobile devices?
Yes, Tableau offers mobile apps for iOS and Android devices that allow users to access and view reports and dashboards from anywhere, as well as interact with them in an intuitive way.