In the world of data analysis, the use of Spatial Parameters in Tableau is revolutionizing the way we interact with maps and geographic data. Thanks to this functionality, it is now possible to filter and visualize specific locations in real time, improving decision making and user experience.
What are Spatial Parameters?
Spatial data includes points, lines and polygons stored in formats such as Shape Files, KML, GeoJSON and Ersi files. Unlike maps generated with traditional latitude and longitude data, these files contain more detailed geospatial information that enables advanced analysis in Tableau.
How to work with spatial data in Tableau
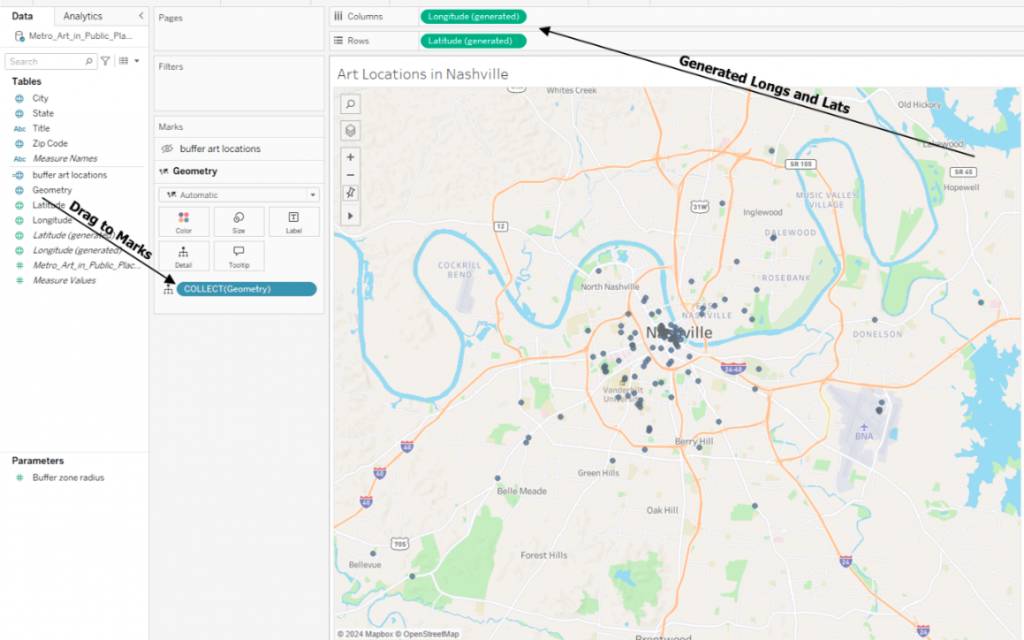
To get started, simply load a spatial file into Tableau. This process allows you to visually represent points of interest on a map. However, the real power lies in the ability to combine multiple spatial datasets.
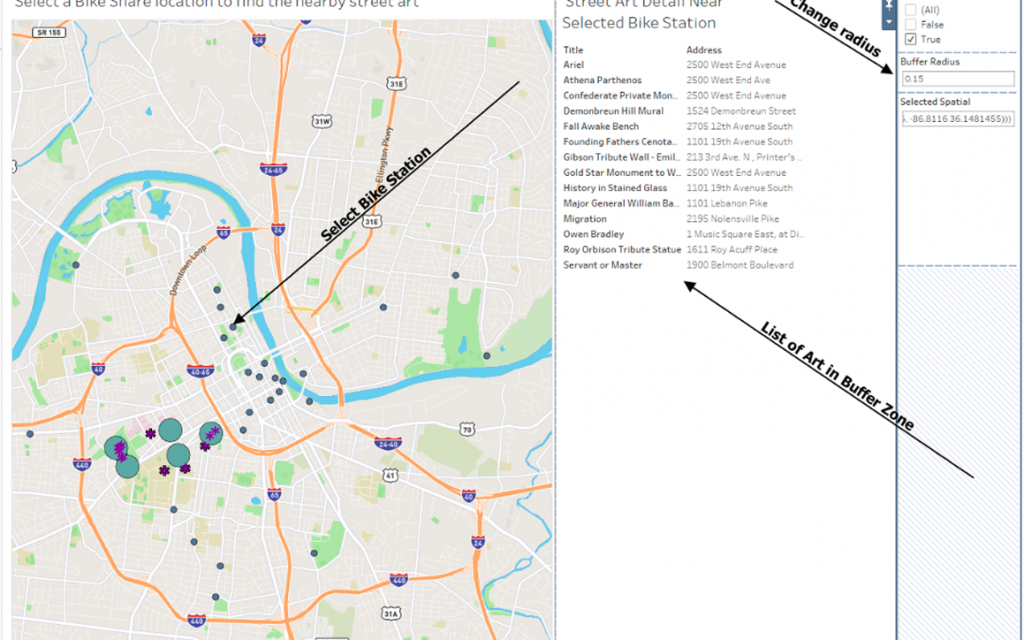
A case study is the overlap of bike share stations and street art locations in Nashville. Thanks to Spatial Parameters, users can set a custom search radius to find art near bike stations, optimizing their ride in the city.
Spatial data intersection for advanced analysis
Spatial Parameters in Tableau allow intersecting geographic data through advanced calculations. This is achieved by generating a buffer (zone of influence) around points of interest and filtering the data according to their proximity. This approach is useful in a variety of applications, from tourism and transportation to urban planning and commercial location analysis.
A prime example is the analysis of Starbucks in New York in relation to subway lines. With the help of spatial parameters, analysts can identify which coffee shops are closest to train stations, allowing them to optimize business and marketing strategies.
Conclusion
The use of Spatial Parameters in Tableau opens up a range of possibilities for interactive data visualization. By integrating this functionality into your dashboards, you can offer more dynamic and personalized experiences.